American global management consulting firm founded in 1963 and headquartered in Boston, Massachusetts. It is one of the Big Three along with Bain & Company and McKinsey & Company.
Context
BCG wanted to streamline their internal analytics tools and unify the user experience across regional teams. The existing system was inconsistent, non-scalable, and hard to navigate for consultants on tight deadlines
Created UX solution for BCG client that helped to reduce time on proccessing and analyzing data by 33%.
It also impact their operations and simplify the process of evaluation various investment options and assess their potential impact on costs, revenue, and profitability.
My Approach
I used Double Diamond as a framework for my process. It involved two main phases: Discovery and Delivery. Goal of Discovery phase: explore and define the core needs of users, receive insights and shape the tool’s functionality.
Constrains
Large-scale design system that was already in place, but outdated, overly complex, and difficult to maintain or scale. Distributed cross-functional teams combined with unclear ownership and overlapping responsibilities. These all led to inconsistent implementation and slowed down collaboration.

Constraint | Action Taken | Outcome |
|---|---|---|
Outdated, fragmented design system | Conducted a full audit of existing components and styles across products. | Identified redundancies and critical gaps; created a clear roadmap for migration. |
Unclear ownership and overlapping responsibilities | Collaborated with design, engineering, and product stakeholders to define a governance model and ownership structure. | Improved accountability, reduced duplicated efforts, and enabled faster decision-making. |
Lack of scalability across teams and business scenarios | Introduced token-based design system and modular components built for reuse. | Enabled consistent UX across multiple white-labeled solutions and accelerated handoff to developers. |
Distributed teams and communication | Established regular cross-functional syncs and feedback sessions. | Strengthened cross-functional collaboration and improved transparency around timelines and deliverables. |
Inconsistent implementation and slowed velocity | Prioritized tasks based on impact, starting with the highest-use design patterns. | Reduced friction in development and improved UI consistency in critical flows. |
Deriving Design Principles from User Research
Before working on user flows, I wanted to deeply understand users’ needs and pain points, so I conducted user interviews.
I had 3 weeks for research and 1 week for analysys. I learned how Financial Managers work with data. I found pain points, user flow gaps and some complex solutions of simple tasks.
The most challenging part was to divide User Research Data and User Feedback. Especially as many interviewees expressed dissatisfaction with the usability of their tools — feedback that was not directly relevant to the specific objectives of this research. To address these challenges, I guided users effectively and adapted the interview questions to better align with the desired outcomes, ensuring the research remained focused and productive.

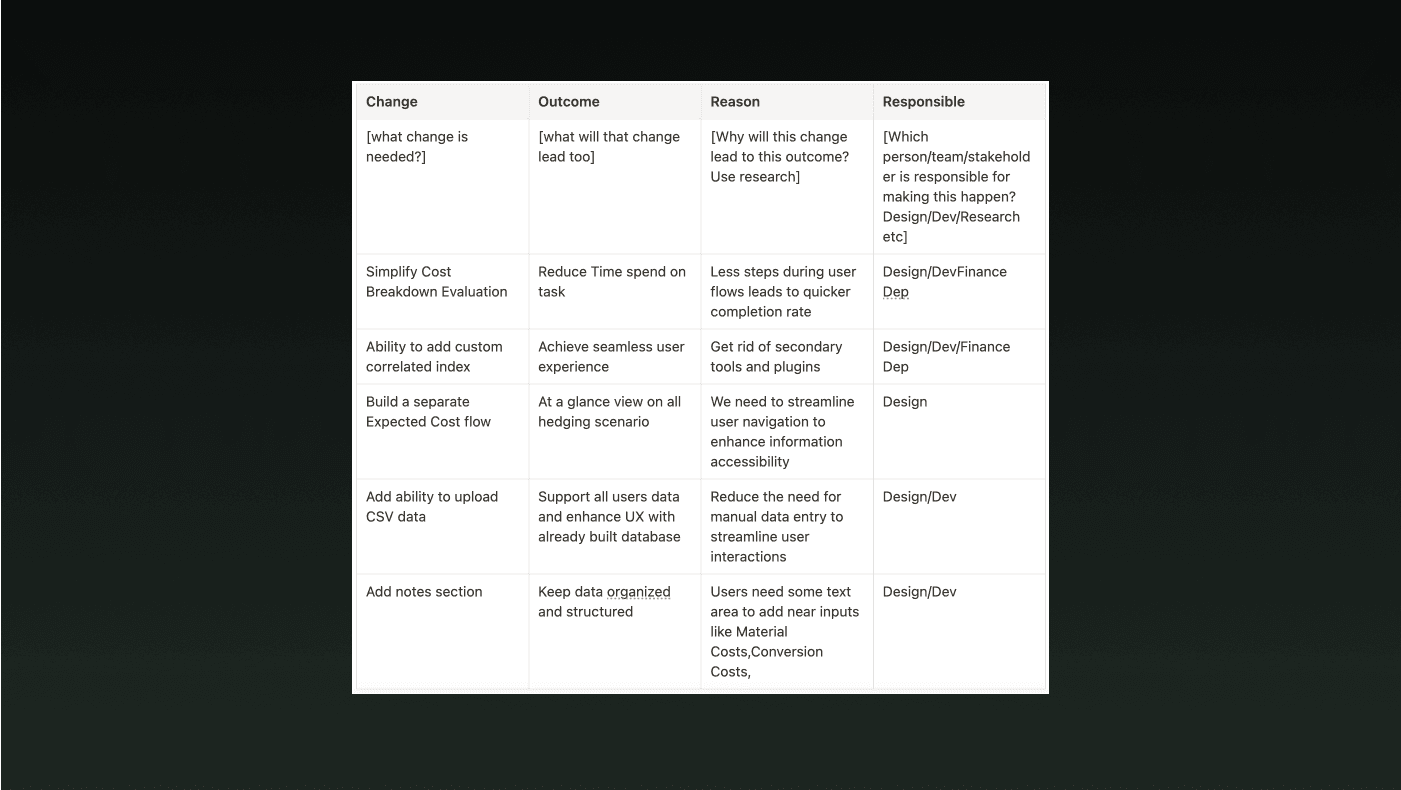
Ideate phase
During this phase I used HMW (How might we...) framework.
During the discovery phase I analyzed received data and figured out desired outcomes from proposed changes. I also conducted shadowing sessions that helped me to finalize all features and mechanics that should work in our app. We discussed with stakeholders and confirmed it afterwards.
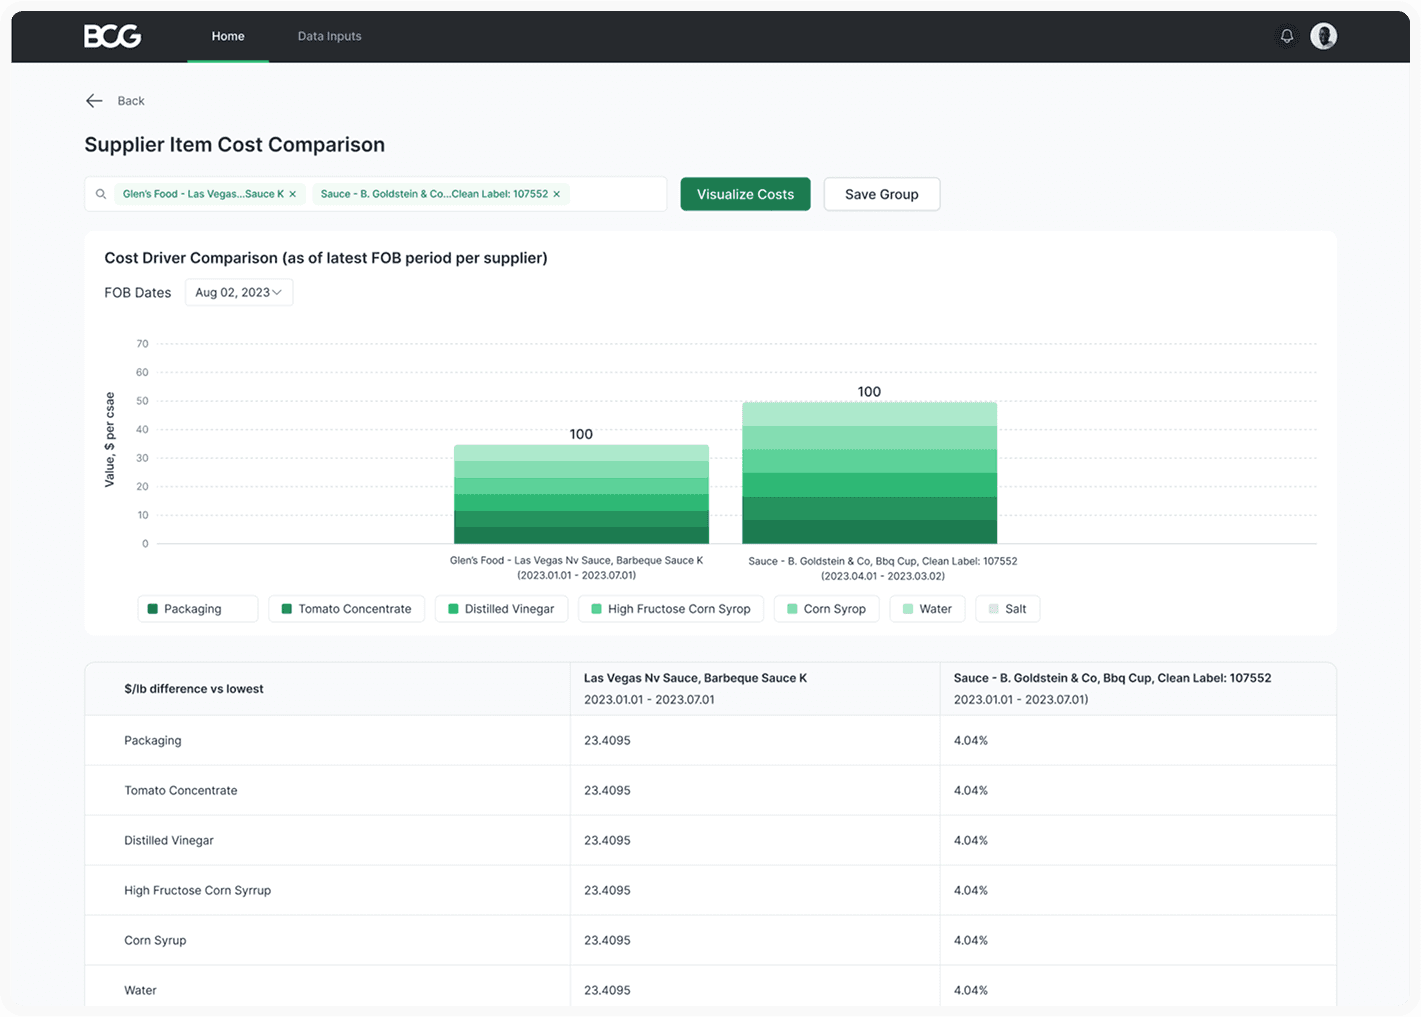

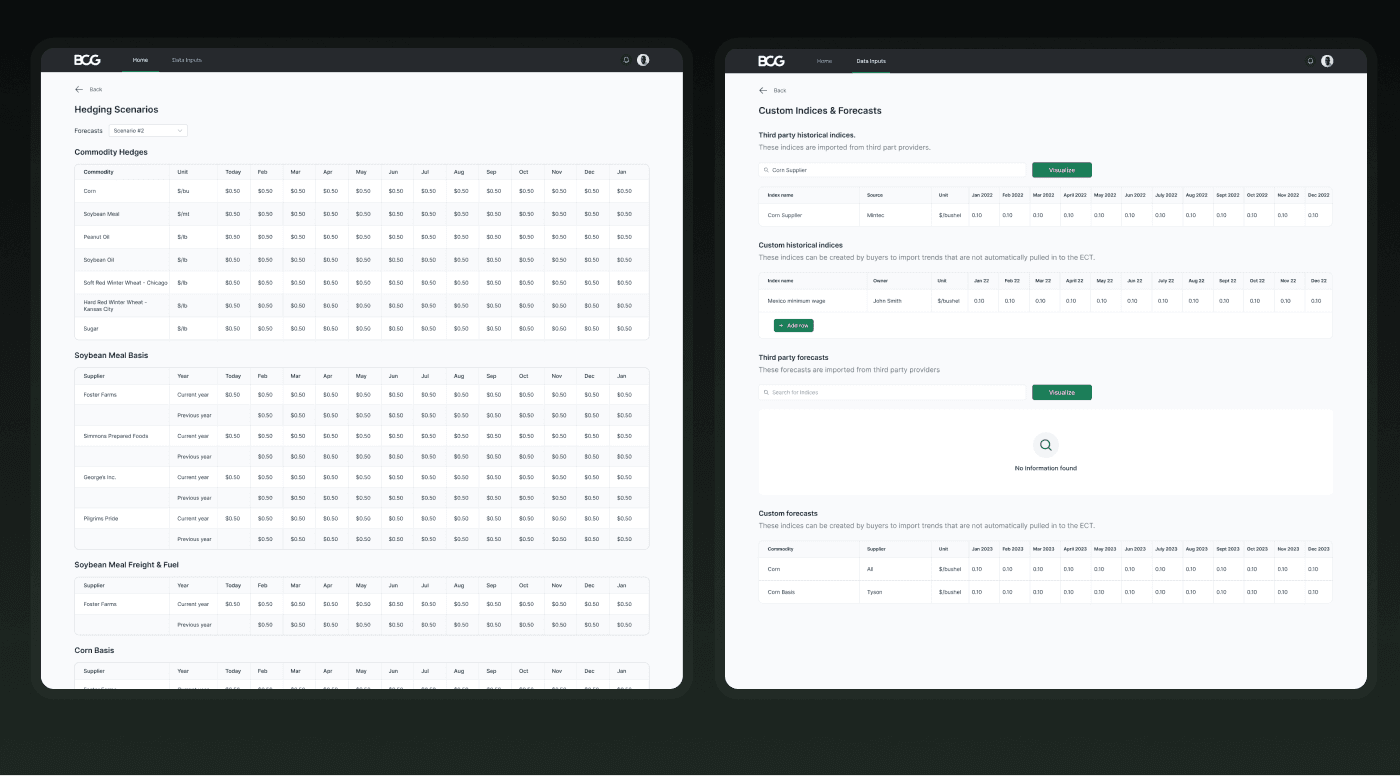
Building Cost Evaluation tool
CET designed to streamline the process of estimating and managing production costs. Tailored specifically for manufacturers, this tool integrates seamlessly into existing workflows, enabling organizations to make informed decisions and optimize resource allocation effectively.

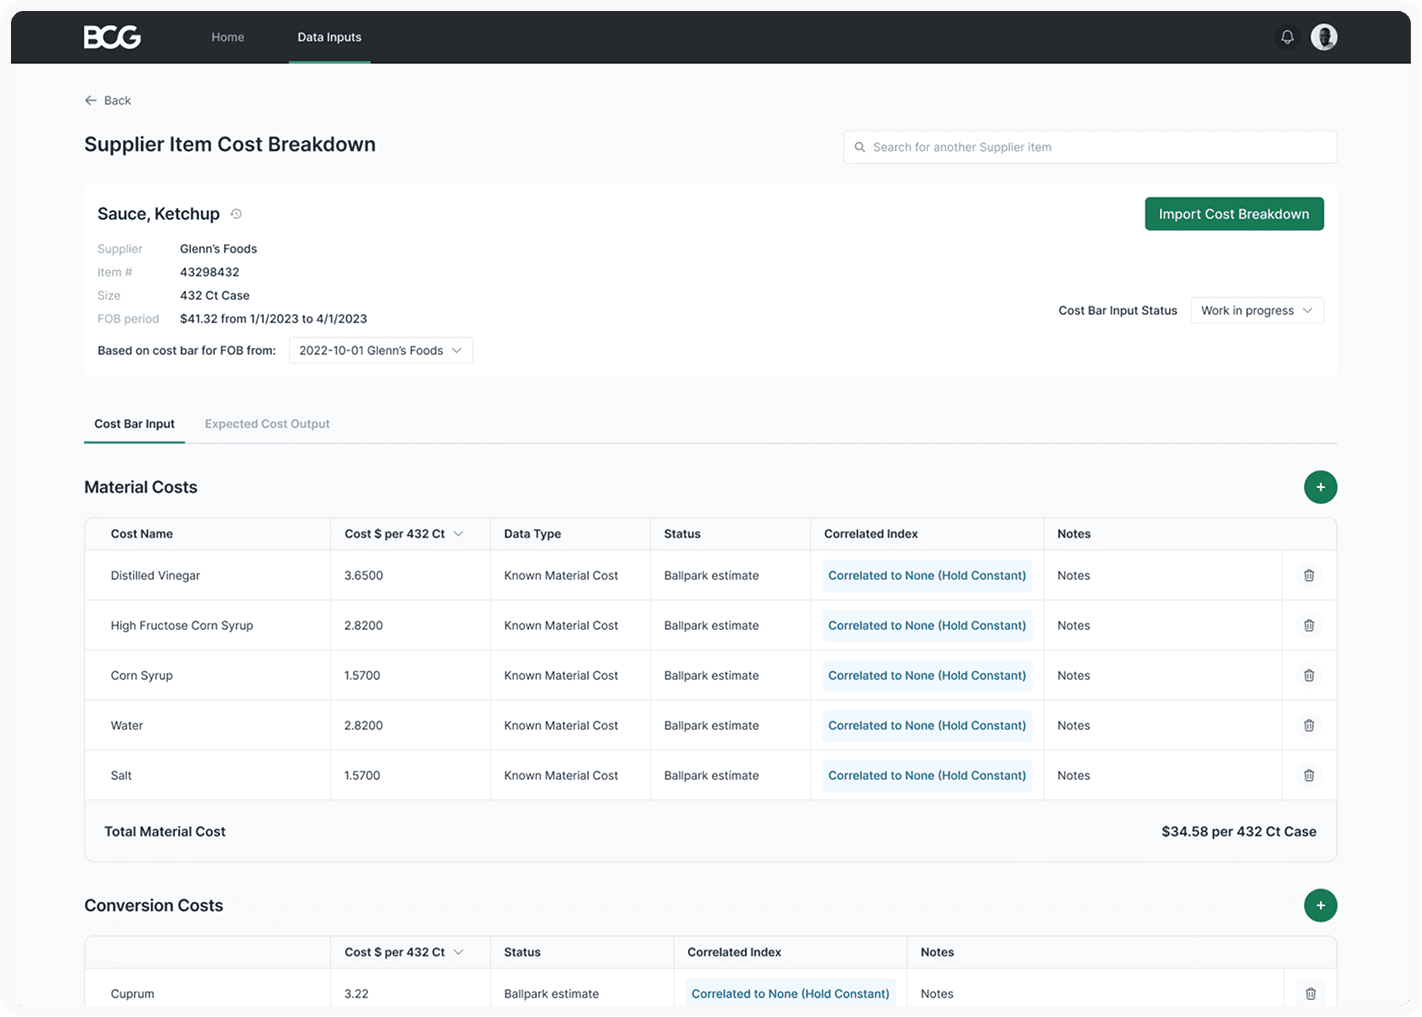
Сost Breakdown tool
This tool designed to streamline the process of estimating and managing production costs. This interface designed specifically for manufacturers. This tool integrates seamlessly into existing workflows, enabling organizations to make informed decisions and optimize resource allocation effectively.
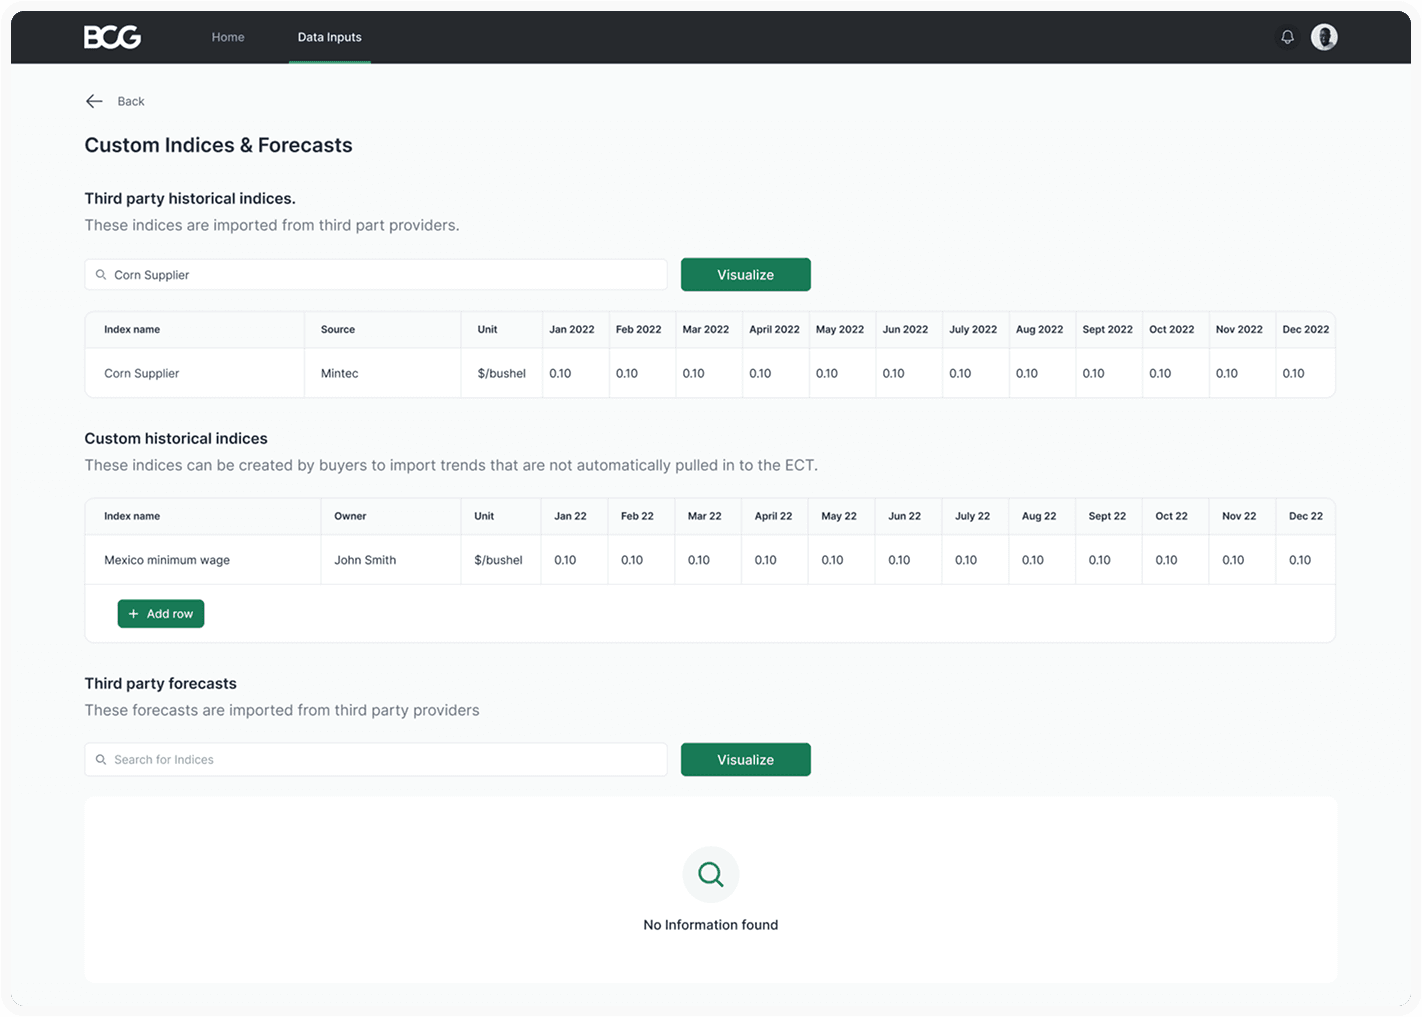